Dashboard 2030 Tracks NC Economic Indicators
Research Triangle Park, NC — RTI International announced yesterday the release of Dashboard 2030, an online tool to track North Carolina’s progress in economic development, business climate and job growth.
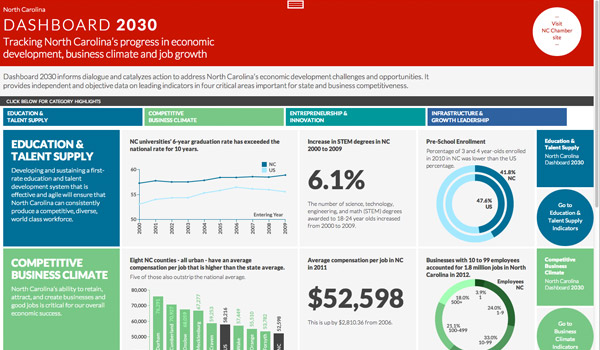
About Dashboard 2030
Dashboard 2030 tracks and visualizes economic trends and opportunities for North Carolina – things like growth in STEM education (6.1%) and average pay for jobs statewide ($52,598).
It was created by RTI International and funded by the North Carolina Chamber Foundation to track progress toward North Carolina Vision 2030 – A Plan for Accelerating Job Growth and Securing North Carolina’s Future.
Dashboard 2013 Design
Dashboard 2030 was developed with the following principles in mind:
- Independence
- Objectivity
- Transparency
RTI International was selected for objectivity and independence. Data-driven visualization addresses transparency: the information is surfaced so that individuals can understand the indicators and perform additional analysis.
A Useful Tool
Data and analytics have always been big in Cary. Now, the Triangle and the entire state is awakening to the potential of big data to influence decision-making, accelerate economic development and create jobs.
Take a look at Dashboard 2030 and let us know what you think: http://ncdashboard.net/
—————————————————————————————————-
Story by Ian Henshaw, Managing Partner of TechTank.


It’s a cool tool indeed, although I won’t be upset if they lose their apparent fondness for the ring charts. A pie chart is a better percentage-of-the-whole representation, and a bar chart is a better visualization of direct comparisons than the concentric rings.